In late 2015, mobile web traffic surpassed desktop for the very first time. Since then, we’ve been living in a mobile world, and mobile device usage has skyrocketed.
One problem—most articles on mobile marketing and mobile usage statistics are terribly outdated. Considering digital technology adoption is speeding along at an ever-increasing rate, things have changed since 2015. Below you’ll find more than 75 of the top (and most recent) mobile marketing statistics in 2019 to guide your mobile marketing strategy in 2020 and beyond.
Let's Grow Together
ENTER YOUR EMAIL TO GET STARTED
Email Subscribe – Global
Your Biggest Mobile Marketing Questions—Answered!
Below are the top four questions users usually have about mobile device usage and online activity:
How Much Time Do Consumers Spend on a Smartphone Daily?
Consumers now spend more than five hours a day on their smartphones, and a recent AdWeek survey found 88% growth year over year in time spent watching videos on a smartphone
What percentage of online traffic is mobile?
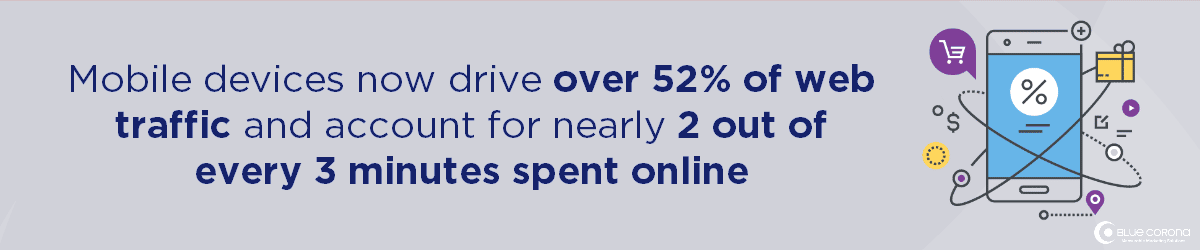
Up to 70% of web traffic happens on a mobile device (CIODive, 2018)
57% of all U.S. online traffic now comes from smartphones and tablets (BrightEdge, 2017)
What Percentage of Emails Are Opened on a Mobile Device?
About 3 in 5 consumers check their email on the go, and 75% of Americans say they use their smartphones most often to check email
80% of email users are expected to access their email accounts via a mobile device by the end of 2018. (Radicati, 2018)
As a whole, in 2017, 61% of U.S. email opens occurred on mobile, 15% on desktop and 24% in a webmail client (Adestra)
What Is Facebook’s Mobile vs. Desktop Usage? What About Other Social media Platforms?
In 2017, 95.1% of active Facebook users accessed the social network via a mobile device (Statista, 2018)
85% of the time users spend on Twitter is on a mobile device (Wall Street Journal)
60% of LinkedIn traffic comes from mobile devices (Fortune, 2017)
80% of people use Pinterest on mobile. (CoSchedule Blog, 2018)
The most popular mobile messenger app globally as of July 2018 is WhatsApp. (Statitsa, 2018)
Consumer Behavior and Mobile Usage Statistics
Almost 9 in 10 smartphone users are not absolutely certain of the specific brand they want to buy when looking for information online. (Google, 2019)
75% of smartphone users expect to get immediate information while using their smartphone. (Google, 2019)
77% of smartphone shoppers are more likely to purchase from companies whose mobile sites or apps allow them to make purchases quickly. (Google, 2019)
Two-thirds of consumers can recall a specific brand they have seen advertised on mobile in the last week. (Business Wire, 2018)
60% of consumers click on mobile ads at least weekly. (Business Wire, 2018)
Mobile searches for “best” have grown over 80% in the past two years (Google, 2017)
51% of customers say that they use mobile devices to discover new brands and products (BrightEdge, 2017)
69% of smartphone users also say that they are more likely to buy from companies with mobile sites that easily address their questions or concerns (BrightEdge, 2017)
Worldwide, more people own a cell phone than a toothbrush. (Consumer Technology Association, 2015)
54% of all mobile brand experiences are video or image-based (Google, 2018)
89% of people are likely to recommend a brand after a positive brand experience on Mobile (Google, 2017)
89% of people on smartphones are using apps, while only 11% are using standard websites. (Disruptive Advertising, 2018)
People today have 2X more interactions with brands on mobile than anywhere else—that includes TV, in-store, you name it (Google, 2017)
46% of people say they would not purchase from a brand again if they had an interruptive mobile experience (Google, 2017)
Users spend on average 69% of their media time on smartphones (Comscore, 2017)
By 2018, American adults are expected to spend, on average, 3 hours, and 23 minutes on nonvoice mobile media. (eMarketer)
Apps account for 89% of mobile media time, with the other 11% spent on websites. (Smart Insights)
80% of smartphone users are more likely to purchase from companies with mobile sites or apps that help them easily answer their questions. (Google, 2018)
Over 51% of smartphone users have discovered a new company or product while conducting a search on their smartphone. (Google, 2018)
Mobile Video Marketing
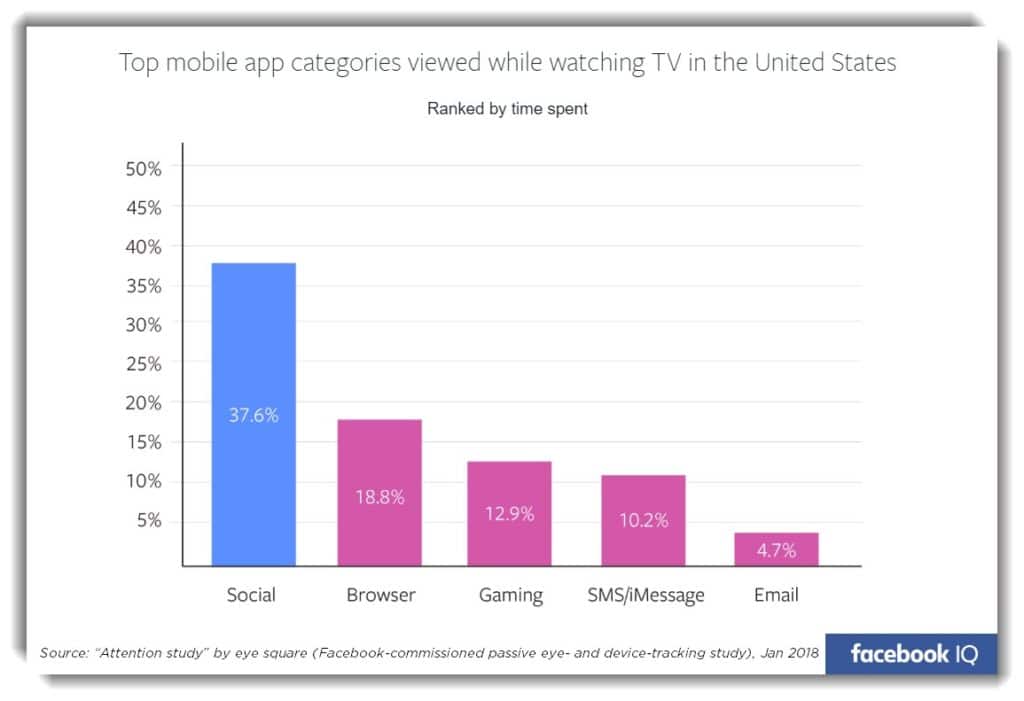
94% of respondents in a Facebook survey (of one million people) have a smartphone on hand while watching TV, and viewers focus on the TV screen just 53% of the time (Facebook, 2018)
Millennials’ mobile consumption has now eclipsed their live TV consumption (comScore, 2018)
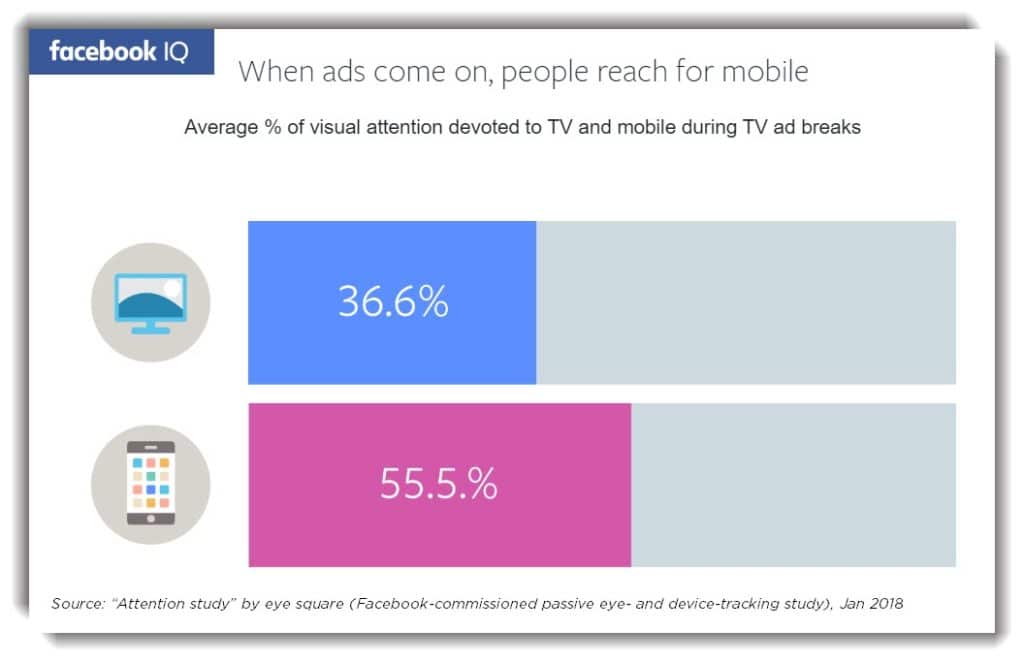
During TV shows, viewers paid attention to mobile 28% of the time, and during TV ads, they paid attention to mobile more than half the time. People ages 18–24 looked at their smartphones 60% of the time during TV ads, and people ages 45 and over did so 41% of the time (Facebook, 2018)
In the past two years, videos with the word “review” in the title had more than 50,000 years worth of watch time on mobile alone (Google, 2017)
Watch time of “does it work” videos grew by more than 11X in the past two years as consumers seek out visual proof that the items they’re considering are worth it (Google, 2017)
More than 50% of videos are watched on mobile (Ooyala, 2016)
93% of Twitter videos are watched on mobile (Twitter, 2016)
Mobile Marketing and Ecommerce
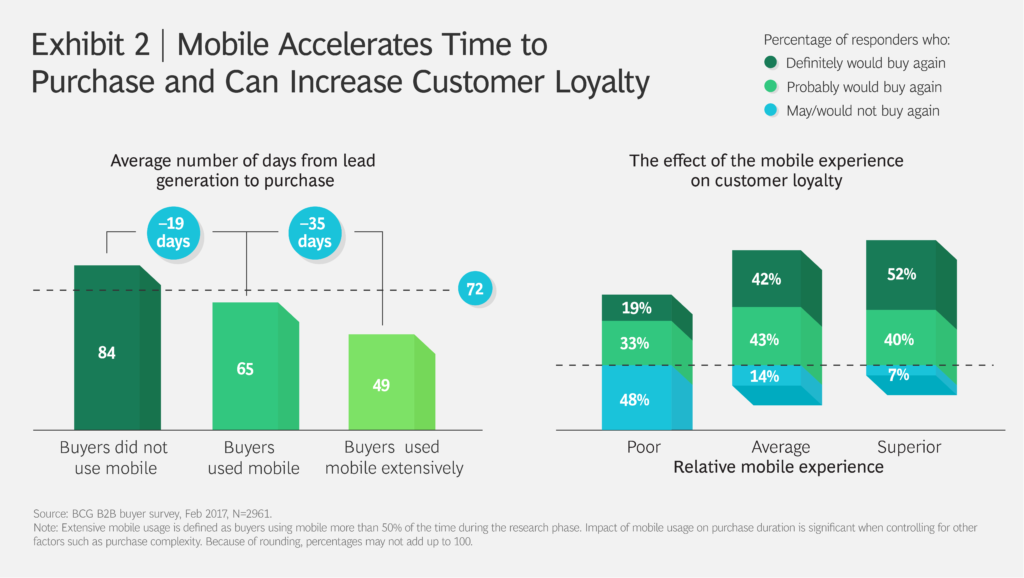
Mobile can fast-track time to purchase by 20% through facilitating efficiencies in decision-making and enhanced team collaboration, particularly with more complex purchases (Google, 2017)
Over 40% of online transactions are now done on mobile (Google, 2017)
Mobile searches related to “same-day shipping” have grown over 120% since 2015 (Google, 2017)
Nearly 2/3 of smartphone users are more likely to purchase from companies whose mobile sites or apps customize information to their location (Google, 2017)
Smartphone users are 50% more likely to expect to purchase something immediately while using their smartphone compared to a year ago (Google, 2017)
91% of smartphone owners purchased or planned to purchase something after seeing an ad they described as relevant (Google, 2017)
When people have a negative brand experience on mobile, they are 62% less likely to purchase from that brand in the future than if they had a positive experience (Google, 2017)
70% of smartphone users who bought something in a store first turned to their phone for information about a purchase (Google, 2017)
35% of people who searched on their phone spent more than they expected in the store (Google, 2017)
Let's Grow Together
ENTER YOUR EMAIL TO GET STARTED
Email Subscribe – Global
Mobile Email Marketing
Mobile readers who open an email a second time from a computer are 65% more likely to click through. (Campaign Monitor, 2019)
Emails that display incorrectly on mobile may be deleted within three seconds. (Campaign Monitor, 2018)
73% of companies surveyed prioritize mobile device optimization of emails. (Campaign Monitor, 2018) Almost every report on email open rates concludes that mobile is responsible for at least 50% of all opens. (Campaign Monitor, 2018)
IT, B2B, and wholesale companies have the weakest mobile email opens, while TV/radio/film, events, and real estate have the strongest mobile email opens. (Campaign Monitor, 2018)
Mobile users check their email three times more than non-mobile users. (Campaign Monitor, 2018)
52% of customers are less likely to engage with a company because of bad mobile experience. (Campaign Monitor, 2018)
35% of business professionals check email on a mobile device. (Convince & Convert, 2018)
The Apple iPhone (29%) and Gmail (27%) remain the most popular ways to read emails. (Litmus, 2018)
Mobile opens accounted for 46% of all email opens in June of 2018. (Litmus, 2018)
Mobile Marketing for B2B Industries
80% of B2B executives research products or services on a tablet in the evening (IDG Global Solutions)
More than 60% of B2B buyers report that mobile played a significant role in a recent purchase (Boston Consulting Group, 2017)
The majority of senior executives (92%) own a smartphone used for business, with 77% reporting they use their smartphone to research a product or service for their business. While the majority (93%) go on to purchase that product via the Internet using a laptop or desktop, 50% of these executives have purchased IT products for business using their smartphone, with 13% reporting making a purchase between $1,000 to $4,999 (IDG Global Solutions)
Mobile usage per B2B worker is expected to increase from two hours a day to three by 2020, driven by millennials, Gen Z, and the increasing use of smartphones by older workers (Google, 2017)
Mobile drives, or influences, an average of more than 40% of revenue in leading B2B organizations (Google, 2017)
50% of B2B search queries today are made on smartphones and will grow to 70% by 2020
More than 90% of buyers reporting a superior mobile experience say they are likely to buy from the same vendor again, compared to only 50% of those who had a poor experience
The State of Mobile Advertising
By 2019, mobile advertising is expected to represent 72% of all U.S. digital ad spending. (MarketingLand)
Google Mobile Click Share in 2019: 56% zero-click, 39.69% organic click, 4.22% paid click
Users spend 25% of their total offline and online media consumption time on mobile, yet advertisers only devote 12% of their budgets to mobile (Boston Consulting Group, 2017)
Leading marketers are more than 3X as likely as the mainstream to be significantly increasing their investment in mobile customer experience (Google, 2017)
87% of Facebook’s advertising revenue comes from mobile (AdWeek)
It’s estimated that U.S. mobile search spending will reach $25.11 billion in 2018 and $28.25 billion in 2019 (AUM Core)
68% of companies have integrated mobile marketing into their overall marketing strategy. (Salesforce)
71% of marketers believe mobile marketing is core to their business (Salesforce)
Mobile Friendly Website Statistics
61% of mobile searchers are more likely to contact a local business if they have a mobile-friendly site. (Junto, 2019)
53% of mobile website visits are abandoned if a mobile site takes longer than three seconds to load. For every one-second delay in site load time, conversions fall by 12% (Google, 2018)
The average mobile webpage still takes 15.3 seconds to load (Google, 2018)
57% of users say they won’t recommend a business with a poorly designed mobile site (socPub)
A delay of one-second in mobile page response can reduce conversions by 7%. (99 Firms, 2019)
54% of people say that their frustration increases as the load time for a brand’s mobile site increases
67% of smartphone users are more likely to purchase from companies whose mobile sites or apps customize information to their location (Google, 2019)
Mobile Search and SEO Stats
Local searches lead 50% of mobile users to visit stores within one day. (Google, 2018)
61% of mobile searches end in no click at all, and 33.7% of desktop searches end in no click at all. (Sparktoro, 2019)
48% of customers started their search for a product on mobile. (Google, 2018)
Google drives 96% of mobile search traffic. (Jody Nimetz Co., 2018)
Over 51% of smartphone users have discovered a new company or product while conducting a search on their smartphone. (Google, 2018)
42% of all mobile brand experiences involve search (Google, 2017)
79% of keywords overall and 47% of keywords in positions 1-20 rank differently in search on mobile and desktop SERPs (BrightEdge, 2017)
35% of the time the first page that ranks for a domain on a query is different on mobile and desktop SERPs (BrightEdge, 2017)
3 in 4 smartphone owners turn to mobile search first to address their immediate needs (Google, 2017)
“Same-day shipping” searches on mobile spike first thing in the morning (Google, 2017)
Search interest in ”open now” has tripled in the past two years (Google, 2017)
More than half of searches related to auto parts, services, and maintenance come from mobile (Google, 2017)
Google has seen 1.5X more mobile searches ending with “to avoid” in the past two years
Nearly 1/3 of all mobile searches are related to location (Google, 2016)
Google drives 96% of mobile search traffic, followed by Yahoo at 2% and Bing at 1%. Google Search is also one of the most popular mobile apps in the United (NetMarketShare)
In 2017, mobile devices accounted for 61.9% of Google’s paid-search clicks – up from 53% in 2016 (iProspect)
we build your strategy to help you outrank and outperform the competition
// Home Services Marketing
SEO (search engine optimization) and paid media are the two most effective ways to increase qualified visitors to your website. If your business doesn’t dominate the first page of search results, you’re losing business to your competition. We help you maximize your search engine real estate across both paid and organic listings on search engines like Google and Bing. This drives more qualified website traffic, calls, and leads to your business (and not your competitors’).
At Blue Corona, we take care of your website for you—from start to finish. The best part? You own 100% of everything we create—the code, content, design—everything. Our websites capture the uniqueness of your brand, deliver a seamless user experience, and serve as the launchpad for your digital marketing campaigns. We provide:
Marketing is only successful if your operations team does its job. At Blue Corona, we help your team capture and convert more leads by providing 24/7/365 call answering services and AI-powered website chat to help you: